Nginx 위치 기반 로그 모니터링
개요
매일 쌓이는 로그를 관리하고 모니터링하기 위하여 로그를 파싱하고 일정 패턴으로 배열해 시각화 대시보드를 구축하는 것은 기업에서 IT 시스템을 관리할 때 필수적으로 사용합니다.
일반적으로는 Elasticsesarch 또는 OpenSearch와 같이 로그에 특화되어있는 솔루션을 사용하지만 본 가이드에서는 Grafana - InfluxDB - Python을 사용하여 Nginx에 적재되는 액세스 로그를 파싱하여 Grafana로 모니터링하는 방법에 대해 가이드합니다.
기존 로깅 솔루션을 사용할 수 없을 때, 또는 고객의 특이한 요구사항이 발생할 때 유용하지 않을까 싶네요
Push-Base / Pull-Base 모니터링에 대한 차이는 여기서 보시면 됩니다.
작동방식
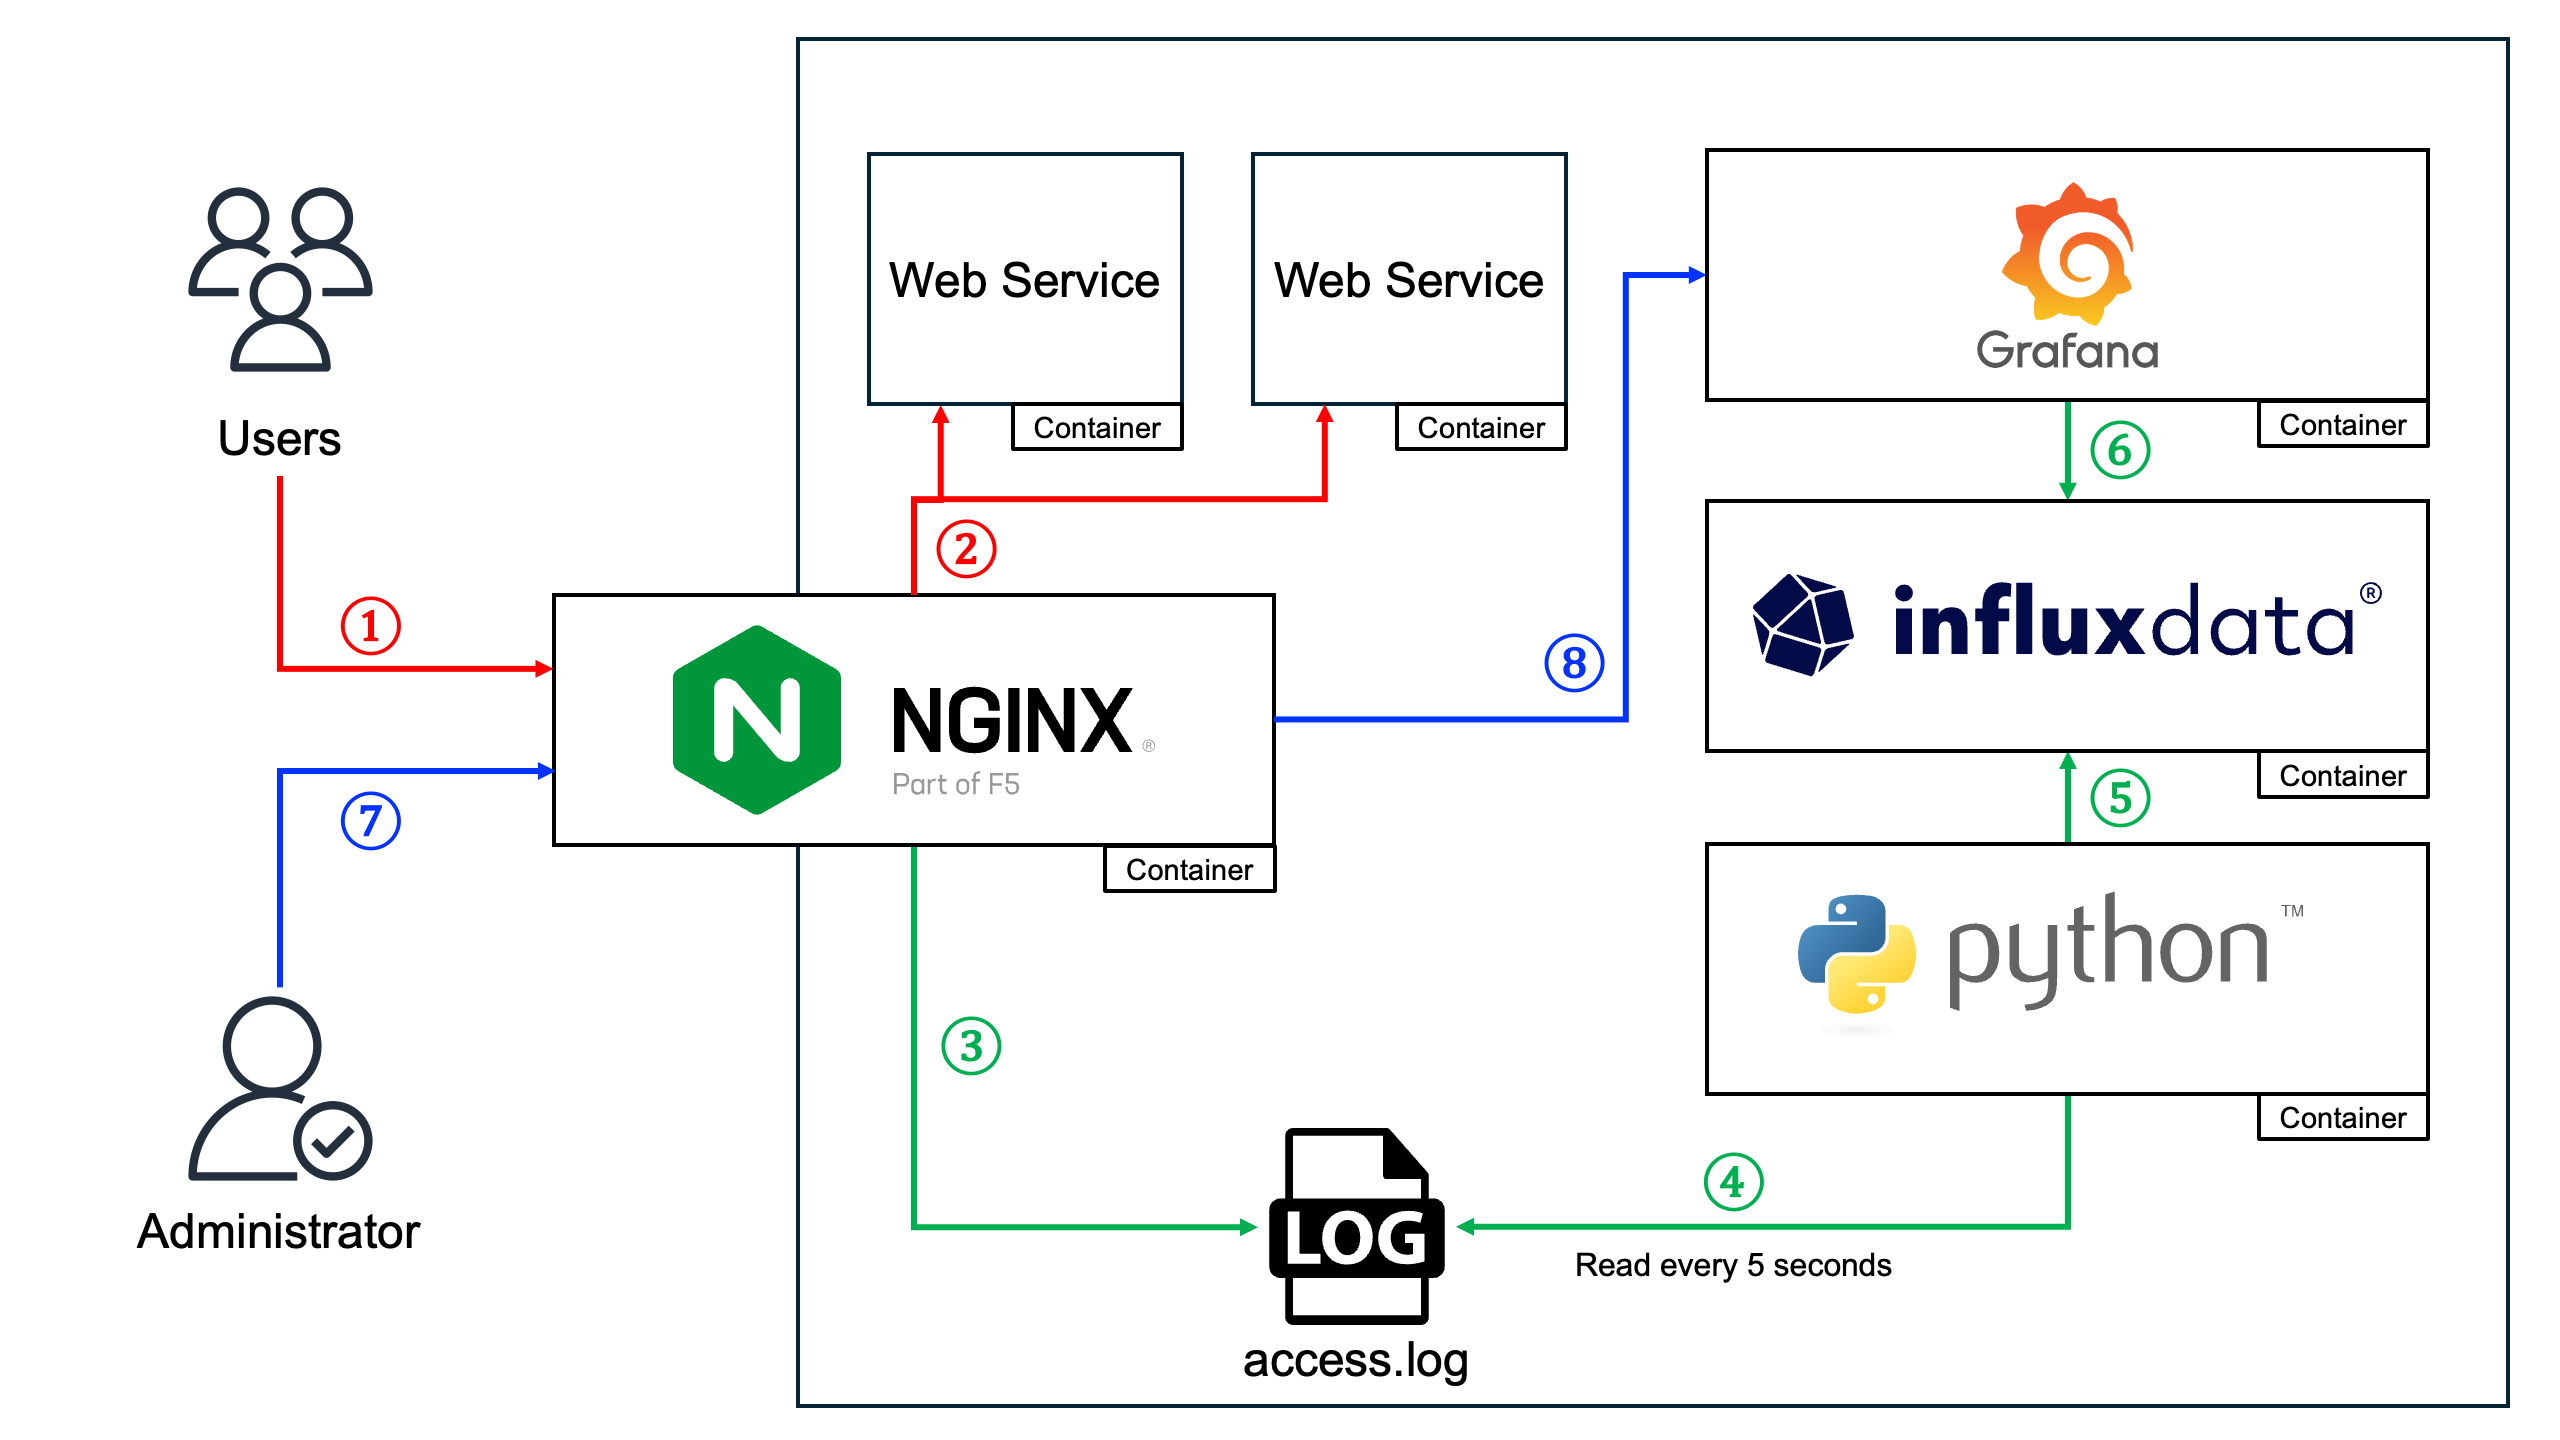
- 사용자가 Nginx(Reverse Proxy)를 통해 Web Service에 접근합니다.
- Nginx는 사용자가 요청한 URL에 적절히 패스합니다.
- Nginx에서는 사용자가 접근할 때 access log를 생성하고 파일에 저장하게됩니다.
이때 GeoIP2 모듈을 사용하여 액세스하는 사용자의 위치정보(국가, 도시)를 함께 저장하게 만들어줍니다. - Nginx에서 이렇게 저장된 access log를 Python 컨테이너(이하 InfluxDB Client)가 5초마다 로그파일을 확인하고 파싱하여 InfluxDB 서버로 전송합니다.
- InfluxDB Client에서 전송한 데이터를 InfluxDB 서버의 TSDB에 저장합니다.
- InfluxDB에 저장되어있는 데이터를 Grafana에서 대시보드를 생성하여 시각화합니다.
- 관리자는 Nginx를 통해 대시보드 확인을 위해 Nginx를 거치게 됩니다.
Nginx는 이런 로그도 수집하게되지만 관리자의 접근은 사용자 통계 대시보드상에 불필요하므로 표시하지 않도록 Grafana 대시보드에 쿼리문을 추가로 넣어줍니다. - 이렇게 완성된 대시보드를 확인하고 뿌듯해하시면 됩니다.
전체 구성
Docker 기반 docker-compose를 사용합니다.
- OS:
Ubuntu 22.04.4 LTS (Jammy Jellyfish) - Kernal:
#111-Ubuntu SMP - Docker:
25.0.4, build 1a576c5- Nginx Image:
nginx:1.25.4 - InfluxDB Image:
influxdb:2.7.5 - Grafana Image:
grafana/grafana:10.4.0 - Python Image:
alpine:3.9(Python 컨테이너 쓰셔도됩니다)
- Nginx Image:
그러니 복붙하지 마시고 꼭꼭 씹어드십시오
GeoIP2 다운로드
인터넷에 돌아다니는 GeoIP 데이터베이스 파일은 더 이상 사용되지 않습니다.
MaxMind GeoLite Legacy databases are currently discontinued, MaxMind GeoIP2 or Geolite2 databases and NGINX Plus GeoIP2 module should be used instead.
MAXMIND에서 무료로 배포한 GeoIP2 데이터베이스를 사용해야합니다.
아래 링크에서 회원가입 후 다운로드합니다.

Nginx 구성
Nginx Plus를 사용하지 않으면 GeoIP2를 사용할 수 없으므로 별도로 GeoIP2 모듈을 추가해 이미지를 빌드합니다.
Nginx 이미지 빌드(ngx_http_geoip2_module 추가)
Docker hub에 올라와있는 Nginx 이미지에 모듈을 추가해 새로운 이미지로 빌드합니다.
Dockerfile
ARG NGINX_VERSION=1.25.4
ARG GEOIP2_VERSION=3.4

FROM nginx:$NGINX_VERSION

RUN apt-get update \
    && apt-get install -y \
        build-essential \
        libpcre3-dev \
        zlib1g-dev \
        libgeoip-dev \
        libmaxminddb-dev \
        wget \
        git

RUN cd /opt \
    && git clone --depth 1 -b $GEOIP2_VERSION --single-branch https://github.com/leev/ngx_http_geoip2_module.git \
    && wget -O - http://nginx.org/download/nginx-$NGINX_VERSION.tar.gz | tar zxfv - \
    && mv /opt/nginx-$NGINX_VERSION /opt/nginx \
    && cd /opt/nginx \
    && ./configure --with-compat --add-dynamic-module=/opt/ngx_http_geoip2_module \
    && make modules

FROM nginx:$NGINX_VERSION

COPY --from=0 /opt/nginx/objs/ngx_http_geoip2_module.so /usr/lib/nginx/modules

RUN apt-get update \
    && apt-get install -y --no-install-recommends --no-install-suggests libmaxminddb0 \
    && apt-get clean \
    && rm -rf /var/lib/apt/lists/* \
    && chmod -R 644 /usr/lib/nginx/modules/ngx_http_geoip2_module.so \
    && sed -i '1iload_module \/usr\/lib\/nginx\/modules\/ngx_http_geoip2_module.so;' /etc/nginx/nginx.conf
Nginx GeoIP2 모듈은 아래 Github에서 가져와 사용했습니다.
 leev
leevNginx Logging & GeoIP2 설정
아래와 같이 log_format 부분과 geoip2 부분을 추가하고 원격에서 InfluxDB Client를 실행한다면 로그 위치도 마운트 된 위치로 변경합니다.
user  nginx;
worker_processes  auto;

error_log  /custom/logs/error.log notice;
pid        /var/run/nginx.pid;

load_module modules/ngx_http_geoip2_module.so;

events {
    worker_connections  1024;
}


http {
    include       /etc/nginx/mime.types;
    default_type  application/octet-stream;

    geoip2 /custom/geoip/GeoLite2-Country.mmdb {
        auto_reload 60m;
        $geoip2_metadata_country_build metadata build_epoch;
        $geoip2_data_country_code country iso_code;
        $geoip2_data_country_name country names en;
    }

    geoip2 /custom/geoip/GeoLite2-City.mmdb {
        auto_reload 60m;
        $geoip2_metadata_city_build metadata build_epoch;
        $geoip2_data_city_name city names en;
    }

    log_format  main  '$remote_addr - $remote_user [$time_local] "$request" '
                      '$status $body_bytes_sent "$http_referer" '
                      '"$http_user_agent" "$http_x_forwarded_for"'
                      '"$request_time" "$upstream_connect_time"'
                      '"$geoip2_data_country_name" "$geoip2_data_city_name" "$server_name"' ;

    access_log  /custom/logs/access.log  main;

    sendfile        on;
    keepalive_timeout  65;
    server_tokens off;

    include /etc/nginx/conf.d/*.conf;
}
Grafana 및 InfluxDB 프록시 설정
grafana.conf
server {
    listen 80;
    server_name watch.domain.com;

    location / {
        return 301 https://$host$request_uri;
    }
}

server {
    listen 443 ssl;
    server_name watch.domain.com;

    include /custom/snippets/ssl.conf

    location / {
        resolver        127.0.0.11      valid=30s;
        set $target http://grafana:3123;
        proxy_pass $target;

        proxy_set_header  Host $http_host;
        proxy_set_header  X-Real-IP $remote_addr;
        proxy_set_header  X-Forwarded-Proto https;
        proxy_set_header  X-Forwarded-For $remote_addr;
        proxy_set_header  X-Forwarded-Host $remote_addr;
    }

    location /api/live/ {
        resolver        127.0.0.11      valid=30s;
        set $target http://grafana:3123;
        proxy_pass $target;

        proxy_http_version 1.1;
        proxy_set_header Upgrade $http_upgrade;
        proxy_set_header Host $http_host;
    }

}GF_SERVER_HTTP_PORT=3123
influxdb.conf
server {
    listen 80;
    server_name watch-infdb.domain.com;

    location / {
        return 301 https://$host$request_uri;
    }
}

server {
    listen 443 ssl;
    server_name watch-infdb.domain.com;

    include /custom/snippets/ssl.conf

    location / {
        resolver        127.0.0.11      valid=30s;
        set $target http://influxdb:8123;
        proxy_pass $target;

        proxy_set_header  Host $http_host;
        proxy_set_header  X-Real-IP $remote_addr;
        proxy_set_header  X-Forwarded-Proto https;
        proxy_set_header  X-Forwarded-For $remote_addr;
        proxy_set_header  X-Forwarded-Host $remote_addr;
    }

}
INFLUXD_HTTP_BIND_ADDRESS=8123
Nginx docker-compose.yaml 배포
version: '3'
services:
  nginx:
    build: ./build
    image: nginx-custom:1.25.4
    container_name: Nginx
    ports:
      - 0.0.0.0:80:80
      - 0.0.0.0:443:443
    volumes:
      ## Default nginx config
      - /docker/nginx/data/nginx.conf:/etc/nginx/nginx.conf:ro
      ## Root and subdomain service configs
      - /docker/nginx/data/http.d:/etc/nginx/conf.d:ro
      ## Snippet files
      #- /docker/nginx/data/snippets:/custom/snippets:ro
      ## SSL/TLS certification files
      - /docker/nginx/cert:/custom/cert:ro
      ## Log storage with NFS
      - /nfs/nginx-logs:/custom/logs:rw
      ## Access location write access.log with GeoIP2
      - /docker/nginx/data/geoip:/custom/geoip:ro
    networks:
      - nginx
    restart: always
networks:
  nginx:
    external: true
Grafana 및 InfluxDB 배포 및 구성
docker-compose.yaml 배포
version: "3"
services:
  influxdb:
    container_name: Influxdb
    image: influxdb:2.7.5
    environment:
      - INFLUXD_HTTP_BIND_ADDRESS=8123
    volumes:
      - /docker/influxdb/data/data:/var/lib/influxdb2
    networks:
      - monitoring
      - nginx
    restart: always

  grafana:
    container_name: Grafana
    image: grafana/grafana:10.4.0
    environment:
      - GF_DASHBOARDS_DEFAULT_HOME_DASHBOARD_PATH=/config-files/dashboard.json # 사전 구성 파일이 없으면 삭제
      - GF_PATHS_PROVISIONING=/config-files/provisioning # 사전 구성 파일이 없으면 삭제
      - GF_SERVER_DOMAIN=watch.domain.com
      - GF_SERVER_SERVE_FROM_SUB_PATH=true
      - GF_SERVER_ROOT_URL=https://watch.domain.com
      - GF_PLUGINS_PLUGIN_ADMIN_ENABLED=true
      - GF_SERVER_HTTP_PORT=3123
    volumes:
      - /docker/grafana/data/data:/var/lib/grafana
      - /docker/grafana/data/config:/config-files:ro
    networks:
      - monitoring
      - nginx
    restart: always

networks:
  nginx:
    external: true
  monitoring:
    external: true
InfluxDB 설정 및 구성
배포 이후 InfluxDB URL에 접속하셔서 기본 설정을 진행합니다.

처음 생성하는 계정은 관리자 계정입니다.
Account와 Organization Name과 Bucket Name을 입력해줍니다.
Grafana 설정 및 구성
배포 이후 Grafana URL에 접속해서 기본 설정을 해줍니다.
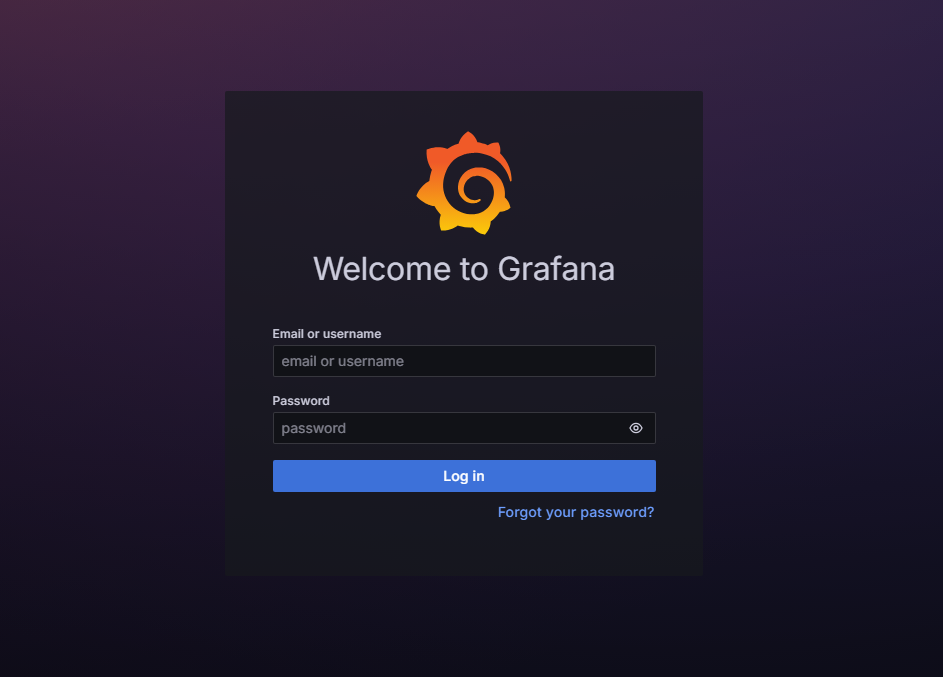
초기 계정은 ID: admin / PW: admin 입니다.
초기 로그인 바로 다음 나오는 창은 패스워드 설정 부분입니다.
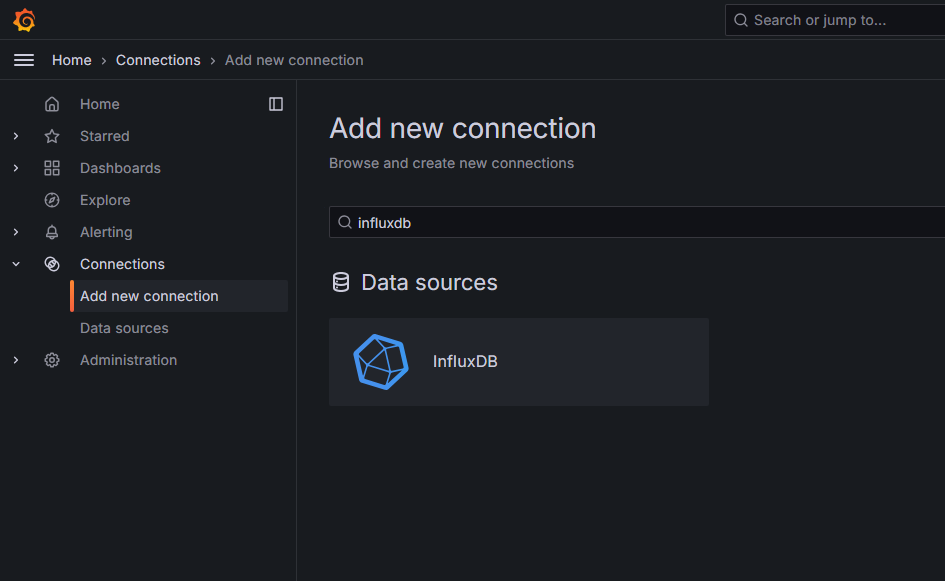
Grafana - InfluxDB 연결
Grafana에서 좌측 메뉴 Connections -> Add new connection -> influxdb 검색 및 클릭 -> Add new data source
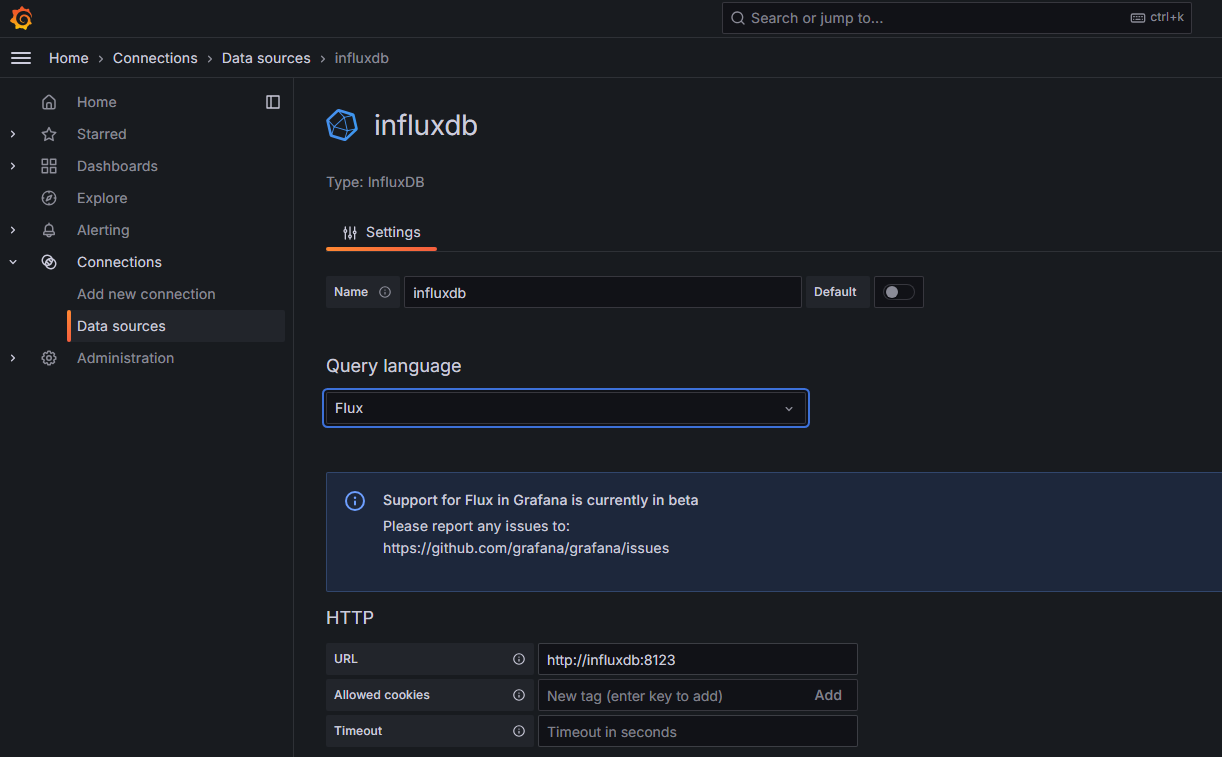
필요한 정보를 입력하는데 중요한 부분은 Query language입니다.
대시보드에서 사용할 쿼리문이며 본 가이드에서는 Flux 쿼리 언어를 사용합니다.
 Gary Fowler /
Rather than recommending or promoting a specific language, we continue to abide by our mantra of “meeting developers where they are.”
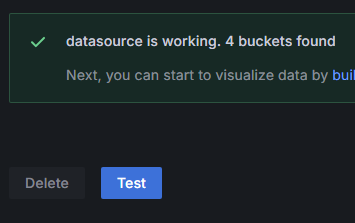
이후 테스트 버튼을 눌러 정상적이면 연결은 완료된 겁니다.
InfluxDB Client 구성
Github에 좋은 예제가 있어서 가져와 일부 코드를 변경해 사용했습니다.
ratibor78collector라는 디렉토리로 바꿔 사용했습니다.
geoparser.py 수정
아래는 제가 파일 내용을 수정한 버전이고
변경 사항은 access log에 $server_name(host name + domain name)을 가져오게 추가했고 이를 가져오도록 코드 일부를 수정했습니다.
# Getting GEO information from Nginx access.log by IP's.
# Alexey Nizhegolenko 2018
# Parts added by Remko Lodder, 2019.
# Added: IPv6 matching, make query based on geoip2 instead of
# geoip, which is going away r.s.n.
# Added possibility of processing more than one Nginx log file,
# by adding threading support. 2022 July by Alexey Nizhegolenko
# Added InfluxDB 2 support. 2022/07/21 by Alexey Nizhegolenko

import os
import re
import sys
import time
import geohash
import logging
import logging.handlers
import geoip2.database
import configparser
from influxdb import InfluxDBClient
from influxdb_client import InfluxDBClient as InfluxDBClient2
from influxdb_client.client.write_api import SYNCHRONOUS
from IPy import IP as ipadd
import threading

class SyslogBOMFormatter(logging.Formatter):
    def format(self, record):
        result = super().format(record)
        return "ufeff" + result

handler = logging.handlers.SysLogHandler('/dev/log')
formatter = SyslogBOMFormatter(logging.BASIC_FORMAT)
handler.setFormatter(formatter)
root = logging.getLogger(__name__)
root.setLevel(os.environ.get("LOGLEVEL", "INFO"))
root.addHandler(handler)

def logparse(LOGPATH, WEBSITE, MEASUREMENT, GEOIPDB, INODE, INFLUXDB_VERSION,
            INFLUXHOST=None, INFLUXPORT=None, URL=None, INFLUXDBDB=None, INFLUXUSER=None,
             INFLUXUSERPASS=None, INFLUXDBTOKEN=None, INFLUXDBBUCKET=None, INFLUXDBORG=None): # NOQA
    # Preparing variables and params
    IPS = {}
    COUNT = {}
    GEOHASH = {}
    HOSTNAME = os.uname()[1]
    if INFLUXDB_VERSION == "1":
        CLIENT = InfluxDBClient(host=INFLUXHOST, port=INFLUXPORT,
                                username=INFLUXUSER, password=INFLUXUSERPASS, database=INFLUXDBDB) # NOQA
    elif INFLUXDB_VERSION == "2":
        CLIENT = InfluxDBClient2(url=URL, token=INFLUXDBTOKEN, org=INFLUXDBORG) # NOQA

    re_IPV4 = re.compile('(\d{1,3}\.\d{1,3}\.\d{1,3}\.\d{1,3})')
    re_IPV6 = re.compile('(([0-9a-fA-F]{1,4}:){7,7}[0-9a-fA-F]{1,4}|([0-9a-fA-F]{1,4}:){1,7}:|([0-9a-fA-F]{1,4}:){1,6}:[0-9a-fA-F]{1,4}|([0-9a-fA-F]{1,4}:){1,5}(:[0-9a-fA-F]{1,4}){1,2}|([0-9a-fA-F]{1,4}:){1,4}(:[0-9a-fA-F]{1,4}){1,3}|([0-9a-fA-F]{1,4}:){1,3}(:[0-9a-fA-F]{1,4}){1,4}|([0-9a-fA-F]{1,4}:){1,2}(:[0-9a-fA-F]{1,4}){1,5}|[0-9a-fA-F]{1,4}:((:[0-9a-fA-F]{1,4}){1,6})|:((:[0-9a-fA-F]{1,4}){1,7}|:)|fe80:(:[0-9a-fA-F]{0,4}){0,4}%[0-9a-zA-Z]{1,}|::(ffff(:0{1,4}){0,1}:){0,1}((25[0-5]|(2[0-4]|1{0,1}[0-9]){0,1}[0-9])\.){3,3}(25[0-5]|(2[0-4]|1{0,1}[0-9]){0,1}[0-9])|([0-9a-fA-F]{1,4}:){1,4}:((25[0-5]|(2[0-4]|1{0,1}[0-9]){0,1}[0-9])\.){3,3}(25[0-5]|(2[0-4]|1{0,1}[0-9]){0,1}[0-9]))') # NOQA

    GI = geoip2.database.Reader(GEOIPDB)
    # Main loop that parses log file in tailf style with sending metrics out
    with open(LOGPATH, "r") as FILE:
        STR_RESULTS = os.stat(LOGPATH)
        ST_SIZE = STR_RESULTS[6]
        FILE.seek(ST_SIZE)
        while True:
            METRICS = []
            WHERE = FILE.tell()
            LINE = FILE.readline()
            INODENEW = os.stat(LOGPATH).st_ino
            if INODE != INODENEW:
                return
            if not LINE:
                time.sleep(1)
                FILE.seek(WHERE)
            else:
                if re_IPV4.match(LINE):
                    m = re_IPV4.match(LINE)
                    IP = m.group(1)
                elif re_IPV6.match(LINE):
                    m = re_IPV6.match(LINE)
                    IP = m.group(1)

                if ipadd(IP).iptype() == 'PUBLIC' and IP:
                    INFO = GI.city(IP)
                    if INFO is not None:
                        HASH = geohash.encode(INFO.location.latitude, INFO.location.longitude) # NOQA
                        COUNT['count'] = 1
                        GEOHASH['geohash'] = HASH
                        GEOHASH['host'] = HOSTNAME
                        GEOHASH['website'] = WEBSITE
                        GEOHASH['country_code'] = INFO.country.iso_code
                        GEOHASH['country_name'] = INFO.country.name
                        GEOHASH['city_name'] = INFO.city.name
                        # Extracting URL from log line
                        url_pattern = re.compile(r'"([^"]+)"$')
                        url_match = url_pattern.search(LINE)
                        if url_match:
                            url = url_match.group(1)
                            GEOHASH['url'] = url
                        IPS['tags'] = GEOHASH
                        IPS['fields'] = COUNT
                        IPS['measurement'] = MEASUREMENT
                        METRICS.append(IPS)
                        # Sending json data itto InfluxDB
                        try:
                            if INFLUXDB_VERSION == "1":
                                CLIENT.write_points(METRICS)
                            elif INFLUXDB_VERSION == "2":
                                write_api = CLIENT.write_api(write_options=SYNCHRONOUS) # NOQA
                                write_api.write(INFLUXDBBUCKET, INFLUXDBORG, record=METRICS) # NOQA
                        except Exception:
                            logging.exception("Cannot establish connection with InfluxDB server: ") # NOQA

def main():
    # Preparing for reading the config file
    PWD = os.path.abspath(os.path.dirname(os.path.realpath(__file__)))
    CONFIG = configparser.ConfigParser()
    CONFIG.read(f'/settings.ini')
    # Get the InfluxDB version so we can parse only needed part of config
    INFLUXDB_VERSION = CONFIG.get('INFLUXDB_VERSION', 'version')

    if INFLUXDB_VERSION == "1":
        # Getting params from config for version 1
        GEOIPDB = CONFIG.get('GEOIP', 'geoipdb')
        LOGPATH = CONFIG.get('NGINX_LOGS', 'logpath').split()
        INFLUXHOST = CONFIG.get('INFLUXDB1', 'host')
        INFLUXPORT = CONFIG.get('INFLUXDB1', 'port')
        INFLUXDBDB = CONFIG.get('INFLUXDB1', 'database')
        INFLUXUSER = CONFIG.get('INFLUXDB1', 'username')
        MEASUREMENT = CONFIG.get('INFLUXDB1', 'measurement')
        INFLUXUSERPASS = CONFIG.get('INFLUXDB1', 'password')
    elif INFLUXDB_VERSION == "2":
        # Getting params from config for version 2
        GEOIPDB = CONFIG.get('GEOIP', 'geoipdb')
        LOGPATH = CONFIG.get('NGINX_LOGS', 'logpath').split()
        URL = CONFIG.get('INFLUXDB2', 'url')
        INFLUXDBTOKEN = CONFIG.get('INFLUXDB2', 'token')
        INFLUXDBBUCKET = CONFIG.get('INFLUXDB2', 'bucket')
        MEASUREMENT = CONFIG.get('INFLUXDB2', 'measurement')
        INFLUXDBORG = CONFIG.get('INFLUXDB2', 'organization')

    # Parsing log file and sending metrics to Influxdb
    while True:
        logs = []
        thread_names = []
        for logitem in LOGPATH:
            logs.append(logitem.split(":"))
        for website, log in logs:
            # Get inode from log file
            if os.path.exists(log):
                INODE = os.stat(log).st_ino
            else:
                logging.info('Nginx log file %s not found', log)
                print('Nginx log file %s not found' % log)
                return
            if INFLUXDB_VERSION == "1":
                # Run the main loop and grep data in separate threads
                t = website
                if os.path.exists(log):
                    t = threading.Thread(target=logparse, kwargs={'GEOIPDB': GEOIPDB, 'LOGPATH': log, 'INFLUXHOST': INFLUXHOST,
                               'INODE': INODE, 'WEBSITE': website, 'INFLUXPORT': INFLUXPORT, 'INFLUXDBDB': INFLUXDBDB,
                               'INFLUXUSER': INFLUXUSER, 'MEASUREMENT': MEASUREMENT,
                               'INFLUXUSERPASS': INFLUXUSERPASS, 'INFLUXDB_VERSION': INFLUXDB_VERSION}, daemon=True, name=website) # NOQA
                    for thread in threading.enumerate():
                        thread_names.append(thread.name)
                    if website not in thread_names:
                        t.start()
                else:
                    logging.info('Nginx log file %s not found', log)
                    print('Nginx log file %s not found' % log)
            elif INFLUXDB_VERSION == "2":
                # Run the main loop and grep data in separate threads
                t = website
                if os.path.exists(log):
                    t = threading.Thread(target=logparse, kwargs={'GEOIPDB': GEOIPDB, 'LOGPATH': log, 'URL': URL, 'INFLUXDBTOKEN': INFLUXDBTOKEN,
                               'INFLUXDBBUCKET': INFLUXDBBUCKET, 'MEASUREMENT': MEASUREMENT, 'INFLUXDB_VERSION': INFLUXDB_VERSION,
                               'INODE': INODE, 'WEBSITE': website, 'INFLUXDBORG': INFLUXDBORG}, daemon=True, name=website) # NOQA
                    for thread in threading.enumerate():
                        thread_names.append(thread.name)
                    if website not in thread_names:
                        t.start()
                else:
                    logging.info('Nginx log file %s not found', log)
                    print('Nginx log file %s not found' % log)

if __name__ == '__main__':
    try:
        main()
    except Exception:
        logging.exception("Exception in main(): ")
    except KeyboardInterrupt:
        logging.exception("Exception KeyboardInterrupt: ")
        sys.exit(0)
collector/settings.ini
초기 git clone시 settings.ini.back 파일로 존재하니 이름을 변경하거나 복사하여 사용해줍시다.
변경해줄 내용은 아래와 같습니다.
INFLUXDB2.url: InfluxDB 컨테이너 주소를 입력합니다.INFLUXDB2.token: InfluxDB 버킷 토큰을 입력합니다.INFLUXDB2.organization: InfluxDB 조직 이름을 입력합니다.INFLUXDB2.bucket: InfluxDB 버킷 이름을 입력합니다.
[NGINX_LOGS]
# Path for the log file (Nginx)
logpath = nginx:/var/log/nginx/access.log

[GEOIP]
# Path for the GEOIP DB file
geoipdb = ./GeoLite2-City.mmdb

[INFLUXDB_VERSION]
# Version of the InfluxDB, 1 = old 1.8 and early, 2 = new 2.0 and more
# Set this parameter to 1 if you prefer to use an old InfluxDB version like 1.8
# Or set this parameter to 2 if you plan to use InfluxDB version 2.1 or modern
version = 2

[INFLUXDB2]
# This part of the config will be used only when [INFLUXDB_VERSION] set to 2

# InfluxDB server URL
url = https://watch-infdb.domain.com

# Token for authentication
token = <YOUR-TOKEN>

# Organization - the name of the organization you wish to write to
organization = <YOUR-ORGANIZATION-NAME>

# Destination bucket to write into
bucket = <YOUR-BUCKET-NAME>

#  Measurement name
measurement = geodata
InfluxDB Client docker-compose.yaml 배포
앞서 말씀드렸듯이 Github에 등록된 Dockerfile의 Base Image는 alpine을 사용하고 있지만 Python Image로 바꿔써도 무방해 보입니다. (몇몇 설정은 바꿔줘야 합니다.)
version: "3"
services:
  log-collector:
    container_name: nginx-log-collector
    build: ./collector
    volumes:
      - /docker/nginx-log-parser/collector/settings.ini:/settings.ini:ro
      - /docker/nginx-log-parser/collector/geostat.service:/lib/systemd/system
      - /nfs/nginx-logs/access.log:/var/log/nginx/access.log:ro # For nginx stub_status
데이터 정상 적재 확인
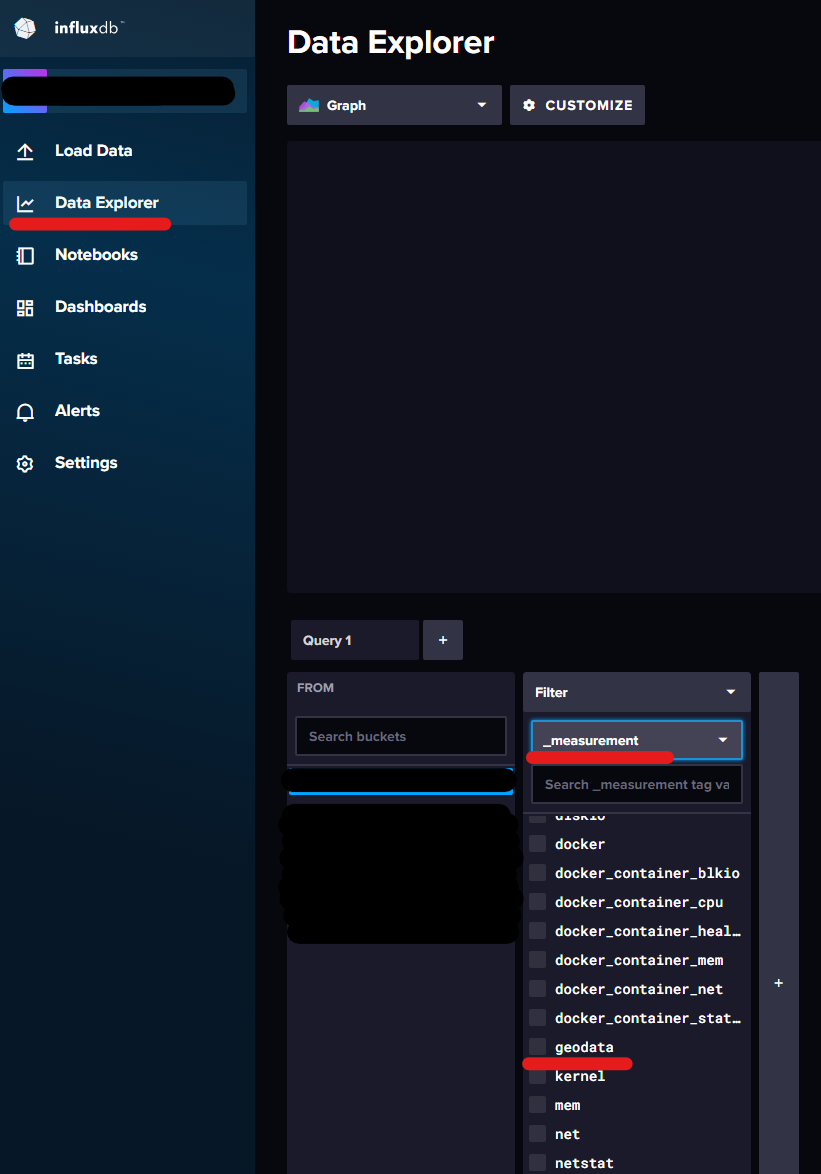
InfluxDB 웹 콘솔에 접근하여 Data Explorer 메뉴에서 버킷안에 geodata 가 정상적으로 등록되어있고 Submit 버튼을 눌러 데이터가 확인된다면 정상적으로 쌓이고 있는 겁니다.
대시보드 구성
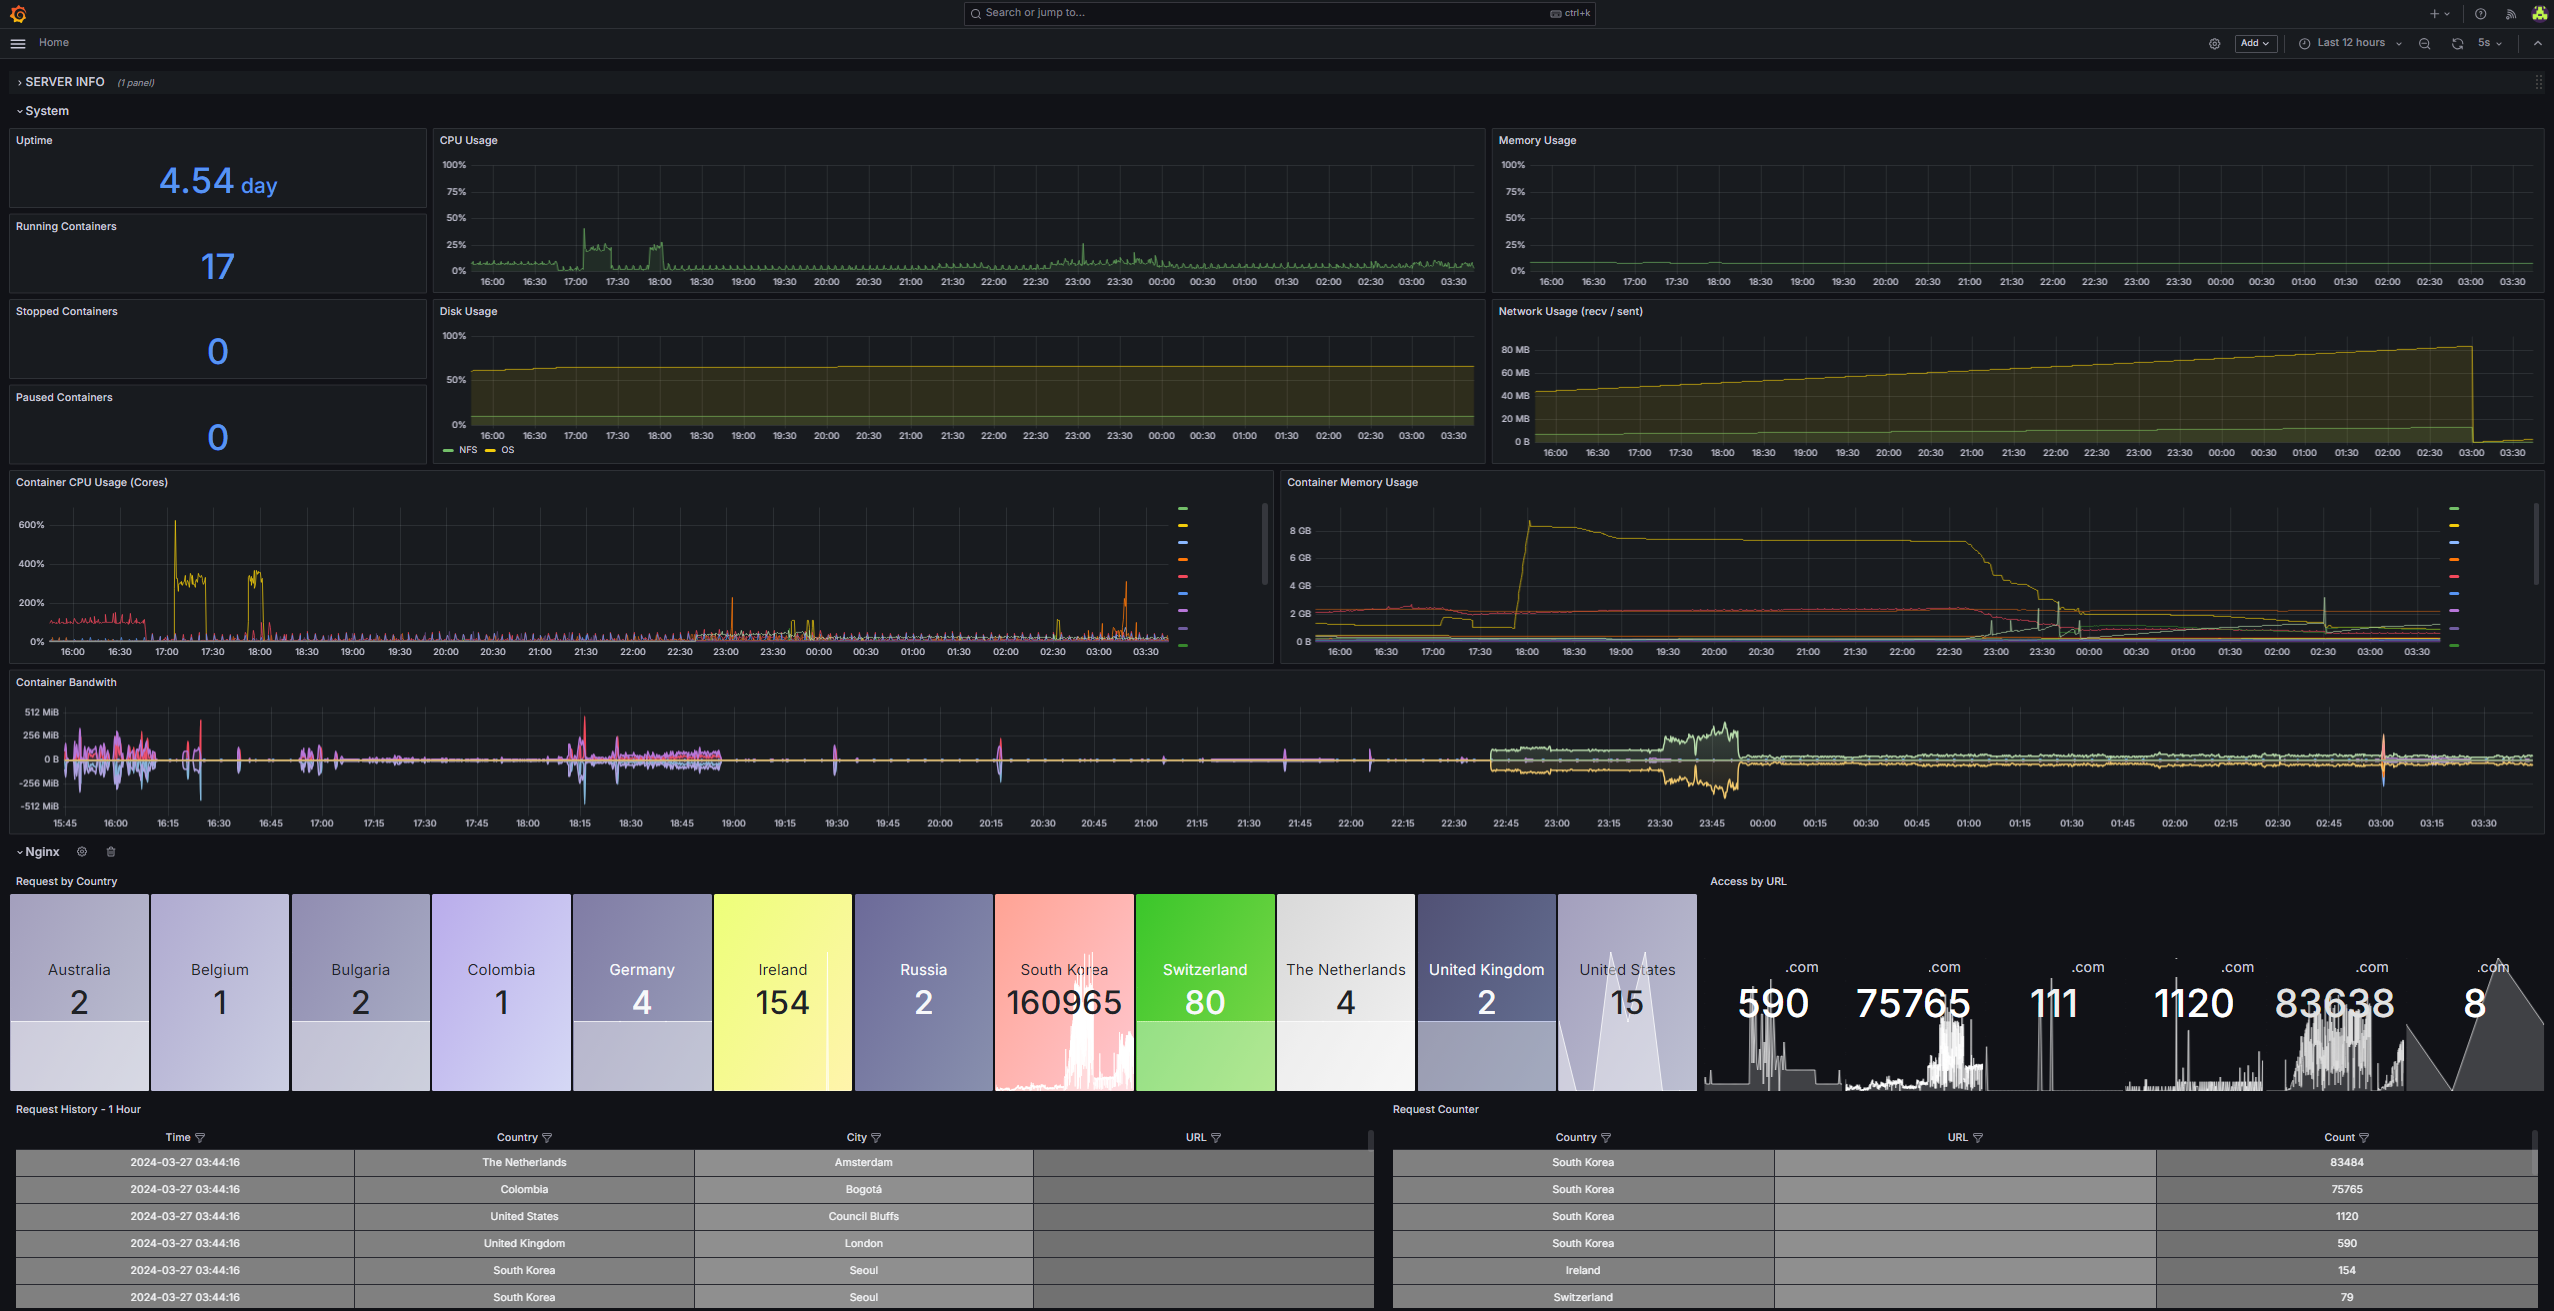
URL Request가 아닌 활성 세션 수를 측정하는게 더 좋을 것 같네요
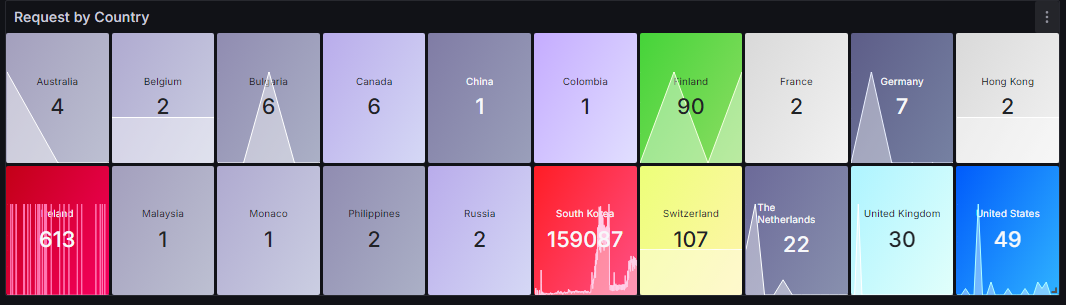
Request by Country
from(bucket: "<YOUR-BUCKET>")
  |> range(start: v.timeRangeStart, stop: v.timeRangeStop)
  |> filter(fn: (r) => r["_measurement"] == "geodata" and r["_field"] == "count" and r["city_name"] != "" and not (r["url"] =~ /^예외\.처리할\.도메인.*/) and not (r["url"] =~ /^sub\.example\.com.*/))
  |> group(columns: ["country_name"])
  |> aggregateWindow(every: v.windowPeriod, fn: sum, createEmpty: false)
  |> map(fn: (r) => ({country_name: r.country_name, count: r._value}))
  |> rename(columns: {"count": ""})
Access by URL
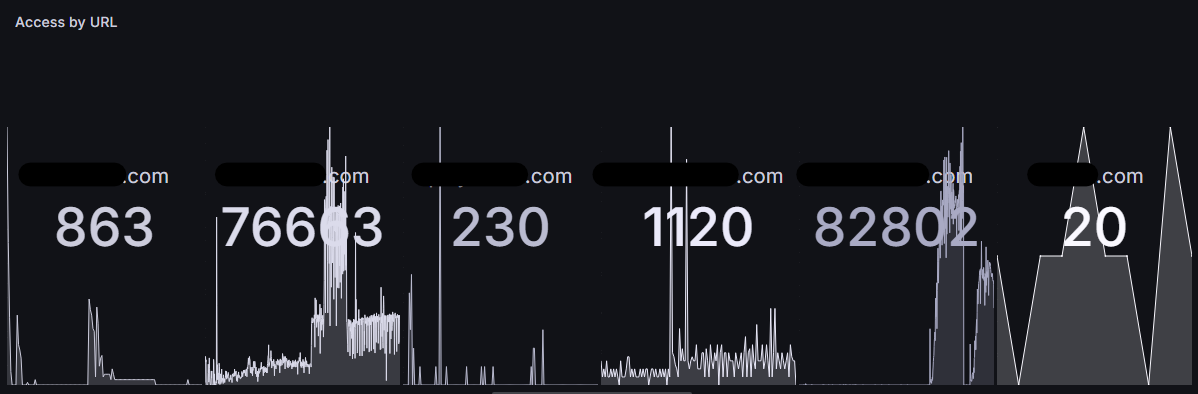
from(bucket: "<YOUR-BUCKET>")
  |> range(start: v.timeRangeStart, stop: v.timeRangeStop)
  |> filter(fn: (r) => r["_measurement"] == "geodata" and r["_field"] == "count" and r["city_name"] != "" and not (r["url"] =~ /^예외\.처리할\.도메인.*/) and not (r["url"] =~ /^sub\.example\.com.*/))
  |> group(columns: ["url"])
  |> aggregateWindow(every: v.windowPeriod, fn: sum, createEmpty: false)
  |> map(fn: (r) => ({url: r.url, count: r._value}))
  |> rename(columns: {"count": ""})
Request History - 1 Hour
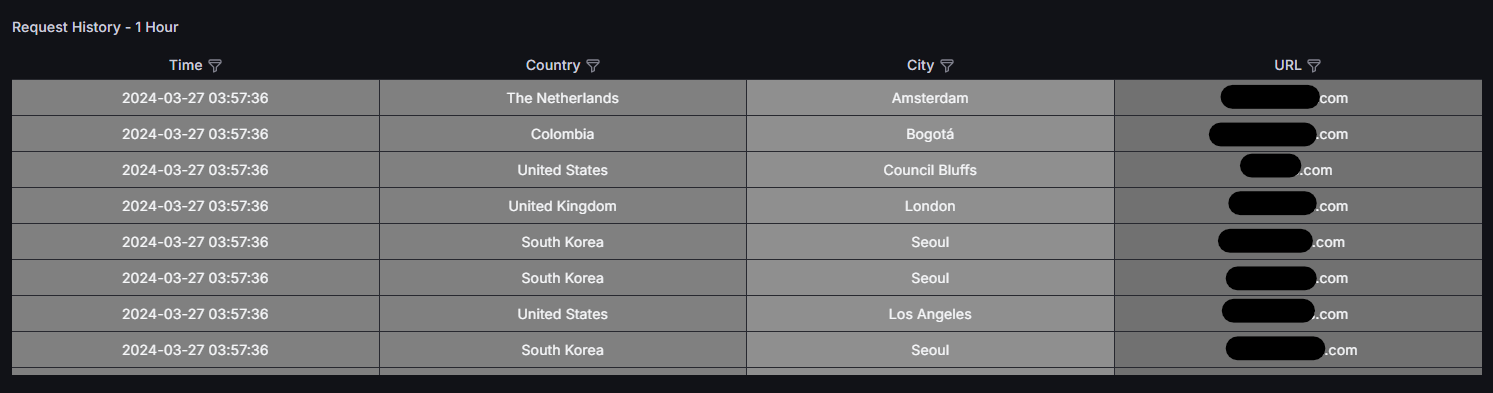
from(bucket: "<YOUR-BUCKET>")
  |> range(start: v.timeRangeStart, stop: v.timeRangeStop)
  |> filter(fn: (r) => r["_measurement"] == "geodata" and r["_field"] == "count" and r["city_name"] != "" and not (r["url"] =~ /^예외\.처리할\.도메인.*/) and not (r["url"] =~ /^sub\.example\.com.*/))
  |> aggregateWindow(every: 1h, fn: sum, column: "_value")
  |> map(fn: (r) => ({
      Time: r._time,
      Country: r.country_name,
      City: r.city_name,
      URL: r.url,
  }))
  |> sort(columns: ["Time"], desc: true)
Request Counter
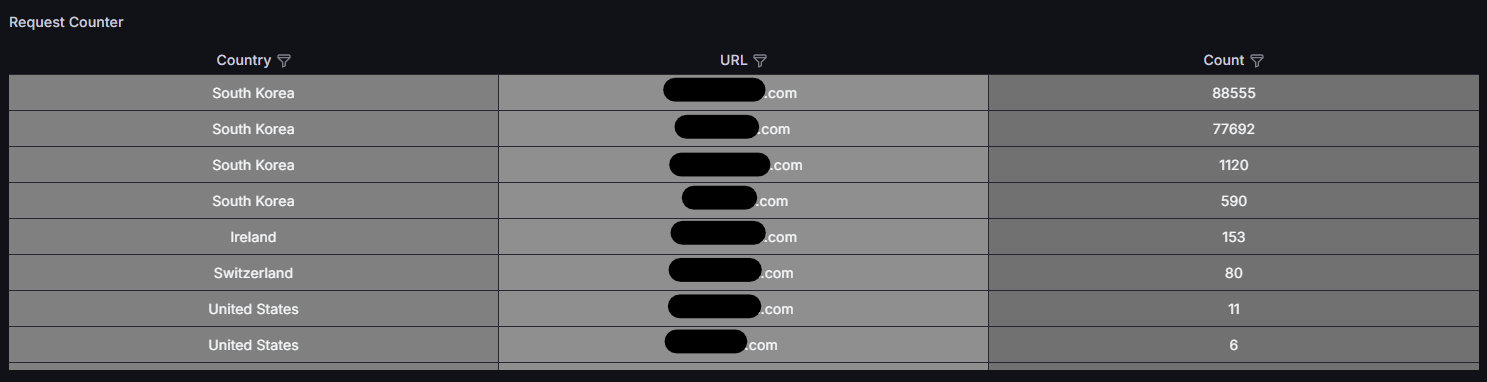
from(bucket: "<YOUR-BUCKET>")
  |> range(start: v.timeRangeStart, stop: v.timeRangeStop)
  |> filter(fn: (r) => r["_measurement"] == "geodata" and r["_field"] == "count" and r["city_name"] != "" and not (r["url"] =~ /^예외\.처리할\.도메인.*/) and not (r["url"] =~ /^sub\.example\.com.*/))
  |> group(columns: ["country_name", "url"])
  |> sum(column: "_value")
  |> map(fn: (r) => ({
      Country: r.country_name,
      URL: r.url,
      Count: r._value
  }))
  |> sort(columns: ["Count"], desc: true)
Member discussion